
Google Analytics might be the most important tool when it comes to visitor and conversion tracking on your website. If you have been hesitating to get started using Analytics, you are in the right place. In this guide we will show you how and where to find the most important metrics and some useful tips.
First and foremost, you need to install Analytics at your website. If you have already done that: great! You can skip to the next paragraph. If not, you can find many great guides on this subject by doing a quick search on Google. The installation process will vary depending your website’s publishing solution. If you use WordPress for example, you should google «Install Google Analytics in WordPress», so you get the right instructions (tip #1).
Use English
If you are using Analytics in any other language then English, don’t. The main reason for this is that you will have much better luck finding help and following tutorials if you use English. (That’s tip #2) To change the language you need to click the gear-icon that says “admin”, then switch from admin to user in the top left corner. Select English click “save”.
Time to get started
Let’s be honest, the first time you open Analytics it might seem a bit overwhelming. But trust me, it’s a lot easier to use than it might seem.
The dashboard
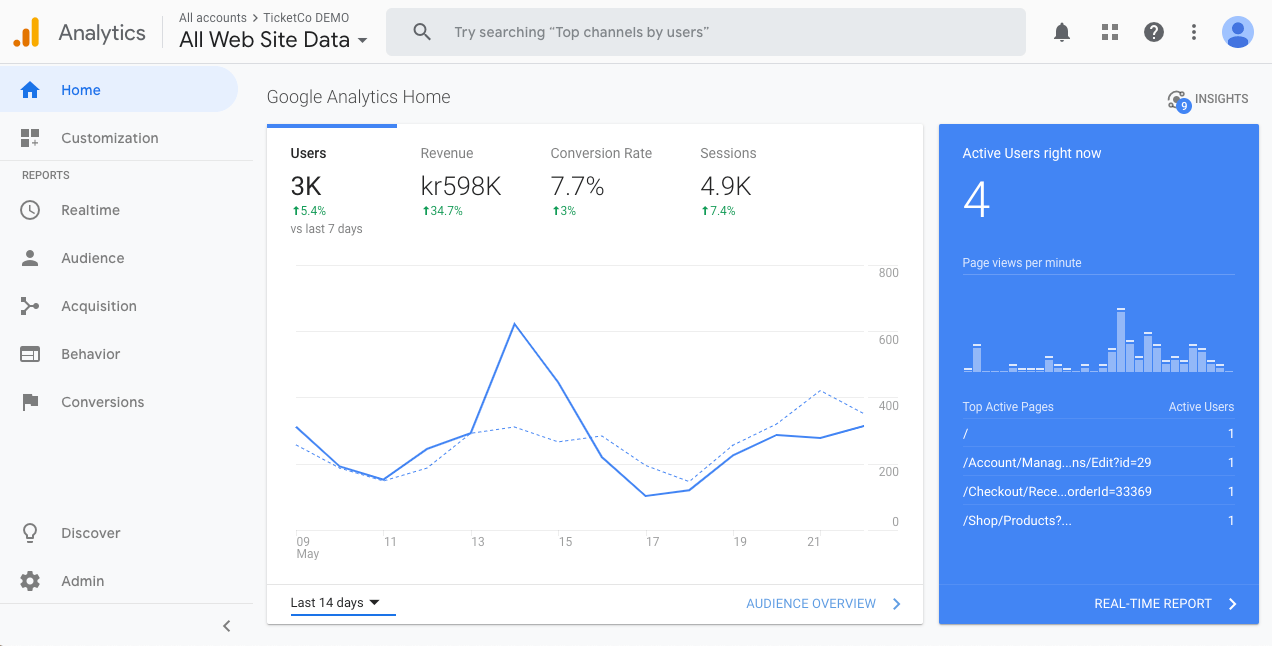
When entering Analytics, it will load the dashboard («home»-tab) by default. Here you can see some of your key metrics (sessions and revenue) for the last seven days compared to the previous seven days, i.e. this current week vs. last week. This is the standard date range in Analytics. I personally prefer comparing weekly numbers, but if you wish to change this to (for example) the last 30 days instead, you can do it from the same place that you change language.
Now It’s time to explain some metrics that we will reuse throughout the guide:
- Users – Number of unique visitors
- Revenue – Your organisation’s billing
- Conversion rate – The percent of the sessions converted
- Sessions – Total amount of website visits.
To sum up, the dashboard shows you the number of visitors and earnings for the last week. It also shows how many active sessions you have, and what pages visitors are browsing in real time, but there is a better way to find this, so let’s jump straight to that.
Real time
This is where you go if you are looking for real time statistics. Here you can find the number of active sessions, what site they came from and where they are located geographically. The “Overview” will give you just that. If you are curious about what pages that are being viewed, click “Content”. And if you want to see what page that led the visitors to your website, you can find that under “Traffic sources”. Recent transactions and goal hits (for the last 30 minutes) are available under “Conversions”. But if you’re looking for these statistics in a historical point of view, you should continue reading the next sections instead.
Acquisition
Now it is time to approach some of the statistics that can seem overwhelming, but bear with me. I prefer using “Source / Medium” located under “All Traffic”. Here, you can see where your traffic is coming from (what source), how much revenue the source has generated. It also shows the “Bounce Rate”, which is a metric used to calculate what percentage of the visitors left your website without taking any actions.
Here’s some examples of typical sources and mediums you will see:
- (direct) / (none): These visitors have most likely typed your website name in the URL field
- Facebook / Referral: have found you on Facebook.
- Google / organic: This means that they have found you through an organic google-search. (what “Organic Keywords” they have used is displayed under “Campaigns”)
If you are doing any digital advertising, you can calculate your ROI (return on investment) and other metrics by clicking “Campaigns”, and select “All Campaigns”.
If you are planning to advertise on Facebook (or anywhere else on the internet) it is normal to track the results using “UTM tags”. The tag tells Analytics what source the traffic came from, and can be customised to each campaign you run. Google has a great tool for creating these tags, which you can find here: Campaign URL Builder.
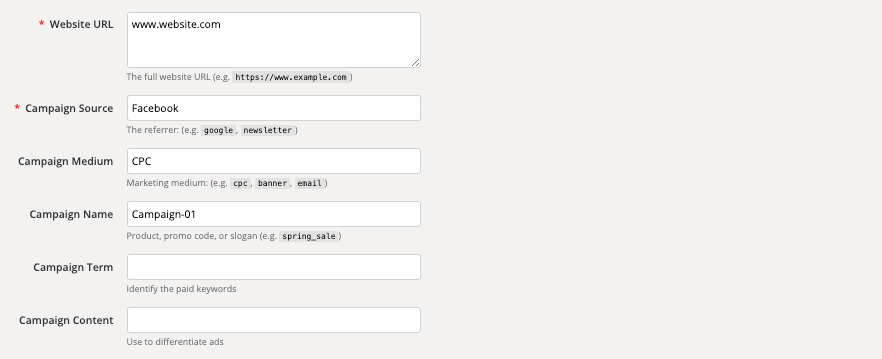
The most important thing to do in the tool is to add your landing page in the “Website URL field”, then define where your campaign is running under “Campaign Source”. And last but not least, name your campaign under “Campaign name”. I also like to add the medium as well. This will generate a campaign URL which looks something like this:
www.website.com?utm_source=Facebook&utm_medium=CPC&utm_campaign=Campaign-01
If you want to find out more about your audience you can learn a lot about it under “Demographics (overview)”, This will show you the age and gender spread among your visitors. You can also view your audience’ “interest”, “Geography” and more. But to be honest, this is not necessarily very useful.
Conversions
E-Commerce (Overview): This is where you can find data about your earnings, from revenue to what tickets that are the most popular.
Goals: You can also set up specific goals for your website. This can be used to collect data about specific actions the visitor may conduct. This can be very useful if you for example have a sign-up form for your newsletter. (tip #3)
Based on what we have looked at today, you can find statistics for:
- Who’s visiting your website
- How did they find you?
- Where does your sales come from?
To summarise: Google Analytics is a great tool in the world of digital sales, so I would strongly recommend you to spend some time exploring it. If you want to learn more, check out Google’s «Analytics Academy» (Tip #4)